Finding a clean box score for a Finals closeout game should not require three tabs and a paywall. The numbers below come straight from the official Game 5 ledger. You get every starter’s line, the quarter-by-quarter swings, and the efficiency margins that decided the series. This is the reference page for knicks vs san antonio spurs match player stats from the 2026 Finals.
A Quick Look at the Rivalry
The Knicks and Spurs had met 107 times in the regular season before this series, with San Antonio holding a 60–47 edge. Their only prior Finals meeting came in 1999, when the Spurs won 4–1 behind Tim Duncan’s Finals MVP run. New York waited 27 years for a rematch. The 2026 series gave the franchise its first championship since 1973.
The Most Recent Matchup: Game 5, June 13, 2026
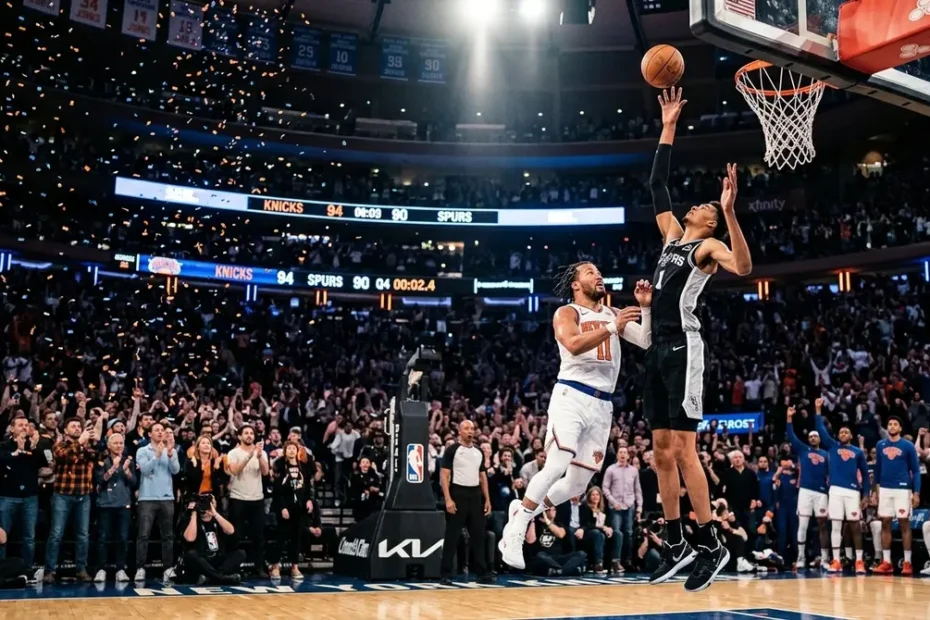
New York closed the series with a 94–90 road win at Frost Bank Center. The Knicks trailed by 16 points in the first half and shot under 30% at halftime, yet they still entered the locker room down only five. Jalen Brunson scored 13 straight New York points in the fourth quarter and finished with a franchise Finals-record 45 points. Dylan Harper led San Antonio with 25 off the bench. Victor Wembanyama added 19 points, 14 rebounds, and five blocks in the loss. The Knicks won the series 4–1 and clinched their first title in 53 years.
Team Totals and Efficiency Comparison
The final score says four points. The efficiency table says the Spurs out-shot the Knicks and still lost. New York won the free-throw battle and the offensive glass, and that was enough to close the gap.
| Metric | Knicks | Spurs |
| Points | 94 | 90 |
| Effective FG% | .425 | .453 |
| Turnover % | 12.4 | 12.1 |
| Offensive rebound % | 28.3 | 28.6 |
| FT/FGA | .230 | .140 |
| Offensive rating | 101.3 | 96.9 |
The Knicks posted a 101.3 offensive rating despite a lower effective field-goal percentage. The difference lives in the free-throw rate: New York generated .230 free throws per field-goal attempt, while San Antonio generated .140. In a four-point game, that margin decides the outcome.
Backcourt Matchup and Playmaking Stats
Brunson’s 45 points on 27 shots with three turnovers is the defining individual line of the series. De’Aaron Fox struggled through one of his worst games of the playoffs: 7 points on 3-of-15 shooting, 1-of-8 from three, five assists, and two steals in 37 minutes.
| Player | Team | MIN | PTS | AST | TOV | FG | 3PT |
| Jalen Brunson | NYK | 41:07 | 45 | 3 | 3 | 14-27 | 4-7 |
| Josh Hart | NYK | 39:10 | 13 | 2 | 1 | 4-11 | 3-6 |
| Mikal Bridges | NYK | 38:34 | 14 | 4 | 0 | 5-10 | 3-7 |
| Dylan Harper | SAS | 31 | 25 | 4 | 0 | 10-19 | 2-4 |
| De’Aaron Fox | SAS | 37 | 7 | 5 | — | 3-15 | 1-8 |
Harper’s 25 points came without a single turnover. Fox’s five assists came with a shooting line that forced San Antonio’s offense into catch-up mode for most of the second half. When you compare knicks vs san antonio spurs match player stats by backcourt production, the gap between Brunson and Fox is the first thing that jumps off the page.
Paint Scoring and Transition Performance
San Antonio won the paint 38–30. New York won the free-throw line 28 attempts to 20. That trade-off defined the game.
| Metric | Knicks | Spurs |
| Paint points | 30 | 38 |
| Fast-break points | 13 | 13 |
| Biggest lead | 4 | 16 |
| Points off turnovers | 18 | 21 |
Wembanyama’s five blocks explain the paint gap. He altered shots without leaving his feet, and San Antonio’s guards funneled drivers toward him. The Knicks adjusted by drawing contact. Brunson attempted 15 free throws. The Spurs as a team attempted 20.
Scoring Distribution and Off-Ball Production
New York’s scoring was top-heavy by design. Brunson accounted for 45 of the team’s 94 points. No other Knick scored more than 14. San Antonio spread the load across three players in double figures, but the bench scoring edge belonged to the Spurs behind Harper’s 25.
| Knicks Player | MIN | PTS | REB | STL | BLK |
| Jalen Brunson | 41:07 | 45 | 3 | 2 | 0 |
| Mikal Bridges | 38:34 | 14 | 2 | 0 | 1 |
| Josh Hart | 39:10 | 13 | 11 | 0 | 0 |
| OG Anunoby | 32:47 | 11 | 8 | 3 | 1 |
| Karl-Anthony Towns | 22:44 | 2 | 10 | 3 | 1 |
| Spurs Player | MIN | PTS | REB | AST | BLK |
| Dylan Harper | 31 | 25 | 5 | 4 | 1 |
| Victor Wembanyama | 38 | 19 | 14 | 2 | 5 |
| Julian Champagnie | 31 | 14 | 7 | 1 | 0 |
| Devin Vassell | 39 | 12 | 7 | 2 | 1 |
| De’Aaron Fox | 37 | 7 | 0 | 5 | 0 |
Karl-Anthony Towns fouled out after 22 minutes but still pulled down 10 rebounds. Josh Hart’s 11 boards gave New York second-chance possessions that San Antonio could not match. The knicks vs san antonio spurs match player stats in the rebound column explain why the Knicks survived a 35.6% shooting night.
Defensive Plays, Turnovers, and Blocks
The defensive counting stats are close. The timing was not. OG Anunoby’s three steals disrupted San Antonio’s wing actions in the fourth quarter. Wembanyama’s five blocks kept the Spurs within striking distance until Brunson’s closing run.
| Defensive Metric | Knicks | Spurs |
| Steals | 8 | 5 |
| Blocks | 3 | 6 |
| Turnovers forced | 12 | 14 |
New York forced 12 Spurs turnovers and converted them into 18 points. San Antonio forced 14 Knicks turnovers and scored 21 off them. The raw margin favors the Spurs by three points. The fourth-quarter margin favored the Knicks by eleven.
Step-by-Step Game-Changing Moments
Q1 — Spurs build the cushion. San Antonio opened with a 23–13 first quarter. Wembanyama’s rim protection and Harper’s early scoring set the tone.
Q2 — Knicks survive the shooting drought. New York shot 13-of-44 in the first half. The Knicks still cut the halftime deficit to 42–37 because San Antonio scored only 19 points in the second quarter.
Q3 — Spurs push the lead back to 16. San Antonio stretched the margin midway through the third. A flagrant foul on Mitchell Robinson led to a six-point Spurs possession and a 12-point lead.
Q4 — Brunson takes over. Brunson scored 13 consecutive New York points in the fourth. The Knicks outscored San Antonio 29–18 in the final frame and sealed the championship.
What the Numbers Tell Us About Each Team
The Knicks are a free-throw-driven, glass-crashing team that leans on one elite creator. That formula worked because Brunson converted at a high rate and the supporting cast won the possession battle. The Spurs are a balanced, defense-first team with a generational rim protector. Their weakness showed up at the line and in late-game shot creation. Fox’s 3-of-15 shooting forced San Antonio to rely on a rookie bench scorer for its half-court offense. Harper delivered 25 points, but the Spurs could not generate enough clean looks when Brunson’s run arrived.
Looking Back: How the Rivalry Has Unfolded Over Time
The 1999 Finals remain the historical reference point. San Antonio won that series 4–1, and the Knicks did not return to the Finals until 2026. The rematch reversed the outcome but followed a similar script: elite defense, a dominant big man, and a guard who controlled the closing minutes. Tim Duncan passed the torch to Wembanyama in spirit. Brunson made sure the Knicks did not leave empty-handed again.
Why Player Stats Matter in This Matchup
Box scores explain why a team wins when the shooting percentages say it should lose. The Knicks shot worse from the field and from three. They won because they generated eight more free-throw attempts and matched San Antonio on the offensive glass despite a lower effective field-goal percentage. Those are not glamour stats, but they are the reason the knicks vs san antonio spurs match player stats tell a different story than the raw shooting splits. Anyone building a model for this rivalry should weight free-throw rate and offensive rebounding heavily.
Final Thoughts and Fan Community Takeaways
The 2026 Finals gave us a series worth revisiting for years. Brunson’s 45-point closeout game belongs in Knicks lore. Wembanyama’s 14-rebound, 5-block performance in a losing effort reminds everyone that San Antonio’s window is just opening. If you are digging through knicks vs san antonio spurs match player stats, focus on the margins: free throws, offensive rebounds, and fourth-quarter shot creation. Those are the numbers that decided this championship.
FAQs
What were Jalen Brunson’s stats in Game 5 of the 2026 Finals?
Brunson scored 45 points on 14-of-27 shooting, including 4-of-7 from three and 13-of-15 from the line. He added three rebounds, three assists, and two steals in 41 minutes.
How did De’Aaron Fox perform in Game 5?
Fox finished with seven points on 3-of-15 shooting, 1-of-8 from beyond the arc, five assists, and two steals in 37 minutes. It was his worst shooting game of the Finals.
What was the halftime score of Knicks vs Spurs Game 5?
San Antonio led 42–37 at halftime. The Knicks shot 13-of-44 in the first half but cut a 16-point deficit to five by the break.
Where can I find the full knicks vs san antonio spurs match player stats?
The official box score lives on Basketball-Reference. NBA.com and ESPN carry full player lines, quarter splits, and play-by-play logs.
Keep Reading

SEO Instant Appear HighSoftware99.com: What It Really Means and How to Get Found Faster
How to Find the Best Duck à L’Orange Near You — A Practical Local Guide
Best Spatzle with Cheese Near Me: A Practical Guide to Finding & Making Käsespätzle
Best Empanada Tucumana Near Me: The Complete Guide to Finding (and Recognizing) the Real Deal

es Mi2Manga (2025): What It Is, How It Works, and Whether It’s Safe to Use